Do Fundamentals Drive DeFi Valuations? An Update with TVL as the anchor and revenue as the edge
by Felix Machart and Mateusz Dominiak – 15 June, 2026
tl;dr
Updated panel: Artemis-based outputs, mid-2021 to March 2026
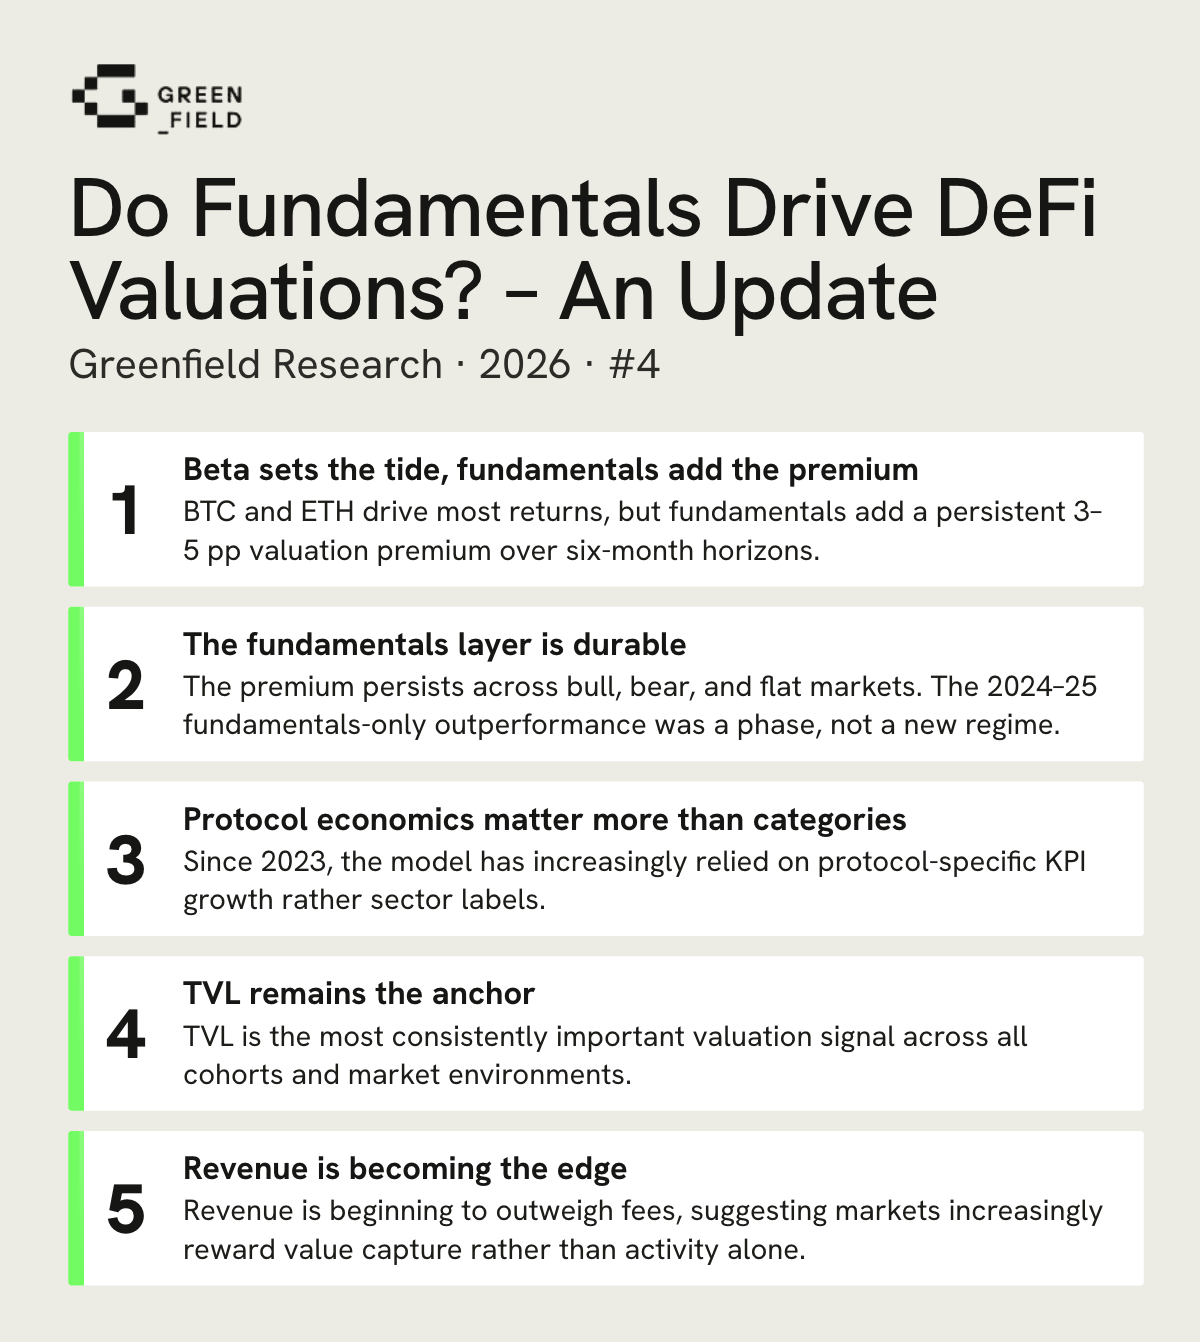
- Consistent fundamentals signal.
Adding protocol fundamentals to a BTC/ETH model lifts six-month explanatory power for DeFi valuations by 3 to 5 percentage points, steady across every time slice and market regime. - Beta is the first valuation layer; fundamentals are the second.
The 2024-H2 episode, in which fundamentals appeared to beat a market baseline on their own, was an unusually clear expression of the second layer, not a sustained trend. By H2 2025, the fundamentals-only model had given back its temporary lead while the combined model (market+fundamentals) held. - The combined model focuses on protocol-specific KPI growth.
Since August 2023, the model has leaned more on each protocol’s own fundamentals rather than on which way BTC and ETH moved or what category a token sits in. - TVL anchors.
Committed capital is the one feature the model leans on most consistently. - Revenue is starting to outweigh fees.
Over the most recent six windows, revenue outweighs fees in the model by about 1.7 percentage points (pp); over the last twelve they are tied; over the full history fees still lead. The market seems to be starting to reward protocol monetization over fees routed across stakeholders. - Net token supply is an early second accrual signal.
On a smaller 17-project subset with published buyback data, net token supply change weighs on token-holder returns more significantly than buybacks lift them. We read this as a candidate signal to watch rather than an established result, given the model’s underperformance in recent periods and the subset’s smaller size.
1. A stable fundamentals premium
Last November, we published a report finding that DeFi token prices had begun to reflect protocol fundamentals, especially at longer time horizons (six-month over 3-month and 1-month), with the pattern strengthening through 2024 and 2025. The headline finding: in the period from mid-2024 through mid-2025, a fundamentals-only model beat a BTC/ETH-only baseline by an average of +12.05 pp of Pearson R².
Five additional months of Artemis data, taking us through March 2026, show that fundamentals-only does not outperform anymore but the combined market+fundamentals (MF) model adds the same +3 to +5 pp it did last year. The case holds across all cohorts and, as Section 2 shows, across all regimes.
Terminology brief: The model estimates six-month log market-cap growth (the “prediction horizon”) from KPI growth over the same period, an ex-post design measuring how the market priced fundamentals in that span. Predictions are scored over a rolling “evaluation window” of up to 12 months, shorter at the panel edge, with a minimum of three months. Cohort means in the latest cohort are therefore noisier than equivalent estimates in earlier cohorts. Throughout this article, “6M” refers to the prediction horizon, not to the evaluation window length.

Figure 1 shows that the combined model has been positive for years, not just recently. Across pre-2024, Jan-Jun 2024, Jul-Dec 2024, Jan-Jun 2025, and Jul 2025+ cohorts, MF prints +3.2, +3.3, +4.5, +4.1, and +4.7 pp. That is a 3-5 pp band that does not depend on whether 2024 or 2025 windows dominate the mix. Pooled across all 48 evaluation windows, the combined model beats market-only at the six-month horizon, and the result is statistically significant, even after accounting for the overlap between adjacent windows: a moving-block bootstrap (block length matched to the 12-month window overlap) yields a one-sided p-value < 0.1%.
Since DeFi returns are concentrated among the top projects, we also look at Spearman rank correlation for robustness regarding outliers. The six-month fundamentals premium passes the rank test on the full sample: the combined model’s mean uplift is +2.8 pp on Spearman against +3.7 pp on Pearson. In the most recent cohorts, the two measures diverge, with the latest-twelve Spearman uplift near zero while Pearson stays around +4 pp. We read this as an expected behavior of a still-early, growth-stage market: when a small number of tokens drive most of the dispersion, fundamentals naturally show up first in the magnitude of those moves, as investors focus on them to a greater extent.
Over the short run, beta is almost the whole story. At a one-month horizon, the BTC/ETH baseline alone already explains about 95% of the variation in returns. The combined model adds essentially nothing on average (cumulative MF mean uplift ≈ -0.1 pp). At three months, the combined model meaningfully beats market-only at the all-window level (cumulative MF mean +1.4 pp, significant at the 1% level). At the six-month horizon, the second valuation layer is most clearly visible, and that is the horizon we focus on in this article.
Fundamentals add real explanatory power, but on top of beta rather than instead of it, and still over multi-month periods rather than over shorter timeframes.
Did the signal grow over time?
The November report argued that the influence of fundamentals on DeFi valuations had grown over 2021-25. With more data, the picture is more nuanced. The standalone fundamentals-only model stopped beating the market baseline, so the “growing influence” story no longer holds for that version. The combined model tells a different and steadier story. The mean uplift has remained within a roughly 3- to 5-point band across half-year cohorts since mid-2022.
A direct era comparison, pre-2024 windows (n=23, MF mean +3.2 pp) versus post-Jan-2024 windows (n=25, MF mean +4.2 pp), is directionally higher post-2024. The era difference (about +1 pp) is, however, not statistically distinguishable from zero (95% confidence interval roughly −0.7 to +2.5 pp). The fundamentals layer has been a feature of DeFi valuation for at least three years, not a new development.
2. Fundamentals-only was a phase, not a regime effect
The exceptional fundamentals-only (FO) uplift referred to the Jul-2024-onward period, an unusual stretch: BTC traded sideways for months, and on-chain monetization improved across protocols. With beta quiet and fundamentals improving, the two largest crypto assets stopped explaining most of DeFi returns, and protocol-specific signals briefly stood out on their own.
, with background shading marking each window’s regime. The combined model stays positive across most of the panel; the fundamentals-only line reaches its deepest trough and one of its highest peaks in bear windows, so its swings track phase rather than regime.")
Figure 2 shows that fundamentals-only outperformance and its subsequent decline are clearly independent of regime. If the fundamentals-only signal were a down-market or up-market phenomenon, its sign would track the shaded bands. It does not. Fundamentals-only printed its deepest negative performance (−10.2 pp) in the 2022 bear and one of its strongest positives (+11.3 pp) in the early-2025 bear, the same regime label showing opposite results.
The combined model, however, is stable across regimes: 4.4 / 3.3 / 3.5 pp across Bull / Flat / Bear in the full sample, and 4.8 / 3.7 / 4.2 pp in the post-Jan-2024 cohort (one late window sits near zero: the December-2025-start window, +0.05 pp, evaluated over only four months). The bear-window uplift now clears the 1% level on the moving-block bootstrap, though the confidence interval is wide: the sample contains only two distinct bear episodes, and they disagree. The 2022 bear predates the rotation onto protocol-specific KPIs described in Section 3 and contributed nothing (−0.1 to +0.8 pp per window), while the 2025-26 drawdown, the first bear since that rotation, averages roughly +4.7 pp across ten overlapping windows. We read this as a progression of stable fundamentals’ importance also in bearish periods.
3. The model has settled into protocol-specific KPI growth
Cohort means, and regime breakdowns ask how well the model fits. A different question is what the model is leaning on, and whether that has changed over time. To answer it, we standardize the 48-window x 11-feature random-forest feature-importance matrix and run principal-components analysis. The first principal component explains roughly 69% of the variance in standardized feature importance. We use it as a one-number summary of how the model rotates between feature types across windows.
 and the sub-segment classifier load together on one side; the protocol-specific KPI growth features load on the other. TVL’s loading is essentially zero, meaning it does not move with this rotation: the model leans on it about equally whichever side is favoured.")
The axis the model rotates along, shown in Figure 3, is not strictly beta versus fundamentals. It separates the beta proxies and the sub-segment classifier from protocol-specific KPI growth. On one side: BTC growth, ETH growth, and the sub-segment. BTC and ETH growth are identical across all protocols within a window, and the sub-segment is a fixed, low-resolution category, so none of the three carries much protocol-by-protocol signal. On the other side: protocol-specific KPI growth (fees, revenue, DEX volumes, DAU, daily transactions, margin, treasury), which takes a different value for every protocol in every window. TVL sits on neither side as the most consistently important protocol-specific fundamental KPI.
The pattern has a clear maturation interpretation. PC1 began deeply negative in early 2022 (-6), when the bear market was effectively beta-only and the model could not extract much signal from individual protocol KPIs beyond category-level differences. Its last negative reading is the August 2023 window. It turns positive in September 2023 and stays there for 29 consecutive evaluation windows through January 2026, with mean values of about 1.6 in both the last 12 and the last 6. Since the rotation happened, the model has been pricing on individual protocol economics rather than on the market proxies and category classifier for more than two years.
The 2024-H2 fundamentals-only outperformance declined, but the model has not flipped back to leaning on beta and sub-category. That is consistent with a market in which protocol-specific economics have become a stable input to valuation.
4. Feature importance: TVL anchors, revenue pulls ahead of fees
Beyond how well the model fits and broader feature categories, the question for both founders and allocators is which specific features the model leans on, and how that mix shifts as the evaluation window shortens from the full 48-window history toward the most recent windows. Two things stand out. TVL ranks at the top of the importance ranking and remains there across all cohorts. Among the rotating protocol-specific features, revenue has been gaining on fees: roughly tied over the latest 12 windows and ahead over the latest 6, after trailing fees across the full sample.
, grouped with BTC and ETH in the market-only baseline.")
Across all 48 windows, fees average 10.3% of normalized importance and revenue averages 9.8% (fees ahead by 0.5 pp). Across the latest 24 windows, fees averaged 12.1% and revenue 11.0% (fees still ahead by 1.1 pp). Across the latest 12, the two are essentially tied (revenue 11.4% vs fees 11.3%). Across the latest 6, revenue prints 11.9% and fees prints 10.2%, a 1.7 pp gap with revenue now ahead.
That is a directional movement across cohorts that matters for the broader DeFi conversation about accrual quality, the question of whether token markets are starting to distinguish gross protocol activity from value that flows to the protocol or to token holders. We see a shift in the model from gross flow (fees) toward value flowing to token holders (revenue).
Margin (defined as earnings divided by revenue, where earnings are revenues net of token incentives) was added to the feature set in this update. It enters at 5-6% of importance across the recent slices. We treat it as a directional quality proxy (zero or near-zero revenue produces extreme values, and the processed panel includes zero and negative observations) and do not anchor any headline conclusion on it currently, also because it has not been growing in importance.
Over time, we would expect a further shift toward profitability, analogous to the equity-market finding that profitability is a robustly priced characteristic, with gross profitability carrying return-predictive power on par with classic value measures (Novy-Marx, 2013).
TVL is the most persistently important feature
Across all 48 windows, TVL pairs the highest mean importance rank with the lowest rank standard deviation of any high-importance feature (see figure 5). The model consistently leans on TVL in both beta-heavy and fundamentals-heavy periods, rather than substituting in and out of it the way it does with fees, revenue, and ETH growth.
 versus standard deviation of importance rank across the 48 evaluation windows. TVL sits in the bottom-right quadrant: high importance, low rotation. Sub-segment is shown as a categorical control.")
Why does TVL behave this way? A few plausible explanations, of which none is mutually exclusive. TVL can be read as a leading indicator for fee and revenue generation, harder to inflate than metrics such as DAUs, and an indication of trust in a given protocol. Also, there are more observations for TVL than for e.g., revenue (in pre-revenue projects/periods). In addition, TVL inflow and outflow are smoother than transaction-level flows even in growth-rate form. Deployed capital is sticky in absolute terms, so TVL growth has lower variance and more serial correlation than fee growth or DAU growth, and a persistently smoother signal can carry consistent information across very different macro regimes. Finally, the MDI feature-importance methodology favors continuous features with high cross-sectional cardinality and smooth time-series structure. Some unknown fraction of TVL’s persistent importance could be methodological rather than market-driven.
Two caveats are specific to TVL. The criticism that TVL importance reflects token-incentive leakage is reasonable. Since TVL responds to token incentives (in dollar terms), and the dollar value of token incentives is inflated by the token price, TVL could co-move with market cap. We exclude direct earnings (revenue minus token incentives) for that reason; they leak the target, and instead include them in derived form as margin: earnings/revenue. Indirect leakage via TVL is harder to rule out. Two things make us skeptical that leakage is the dominant explanation. TVL’s importance has been rising as DeFi has shifted away from emission-heavy incentive programs, when the leakage story would predict the opposite. And a feature whose importance comes mostly from leakage would typically rotate more strongly with the cycle than TVL does. Separate research results that go beyond the scope of this article show the rising share of organic (non-emission-driven) TVL across the DeFi panel since 2022, providing independent structural evidence against the leakage interpretation.
5. Net token supply: a related preliminary signal
The fees-to-revenue movement is not the only signal pointing toward accrual quality. Generally, there has been significant uncertainty about whether traction in a protocol actually leads to value accrual in a token further down the line, as is established with equities. The revenue definition from Artemis already accounts for this to some extent: only cash flows that accrue to token holders in some way or form are included. However, there is no distinction how exactly the value is distributed to token holders. Since there has been an increase in projects conducting token buybacks and significant discussion about whether and when they make sense, we built additional models to test their impact alongside revenue sharing/yield distribution to token holders.
Thus, we add metrics that measure how protocols have been returning capital and/or diluting token holders in addition to the previously mentioned protocol-specific fundamental KPIs and beta proxies. We included active revenue relative to market cap as a measure of revenue sharing with token holders (distributed to active stakers of a token), buybacks relative to market cap, and net token issuance (accounting for both buybacks and token issuance) relative to market cap. The dependent variable used is total token holder return (change in token price + active revenue share) in order to treat the effect of buybacks and yield distribution (measured by active revenue) in an equivalent way, since distributions flow to token holders and are not reflected in the market cap anymore (see also total shareholder return, defined as capital gains + dividend yield).
On the Artemis subset for which buyback data has been published, the two supply-side features behave quite differently from the core protocol economic metrics. Across the full sample, net circulating-supply growth carries roughly 2.8x the importance of gross buybacks and sits among the three most important features alongside BTC and ETH growth, while buybacks rank below every core protocol KPI. Active revenue (yield distribution) ranks even lower than buybacks. Part of that early gap was driven by the fact that few protocols ran buybacks in 2022-23, so the feature had almost no variance for the model to use, and its importance sat near zero. As buybacks spread, the two briefly reached parity around mid-2024, and through early 2025, buyback importance moved ahead, peaking at roughly three times supply-change importance by mid-2025. That did not last, though. Across the second half of 2025, supply-change importance climbed back to the top of the ranking while buybacks leveled off near a tenth of the total. In the latest six windows, net supply change is the single most important feature, ahead of TVL and revenue, and buybacks sit just above TVL. The reversal is driven by a sharp rise in the importance of supply change from September 2025 onward, which is also the period when evaluation windows shorten to between three and eight months.
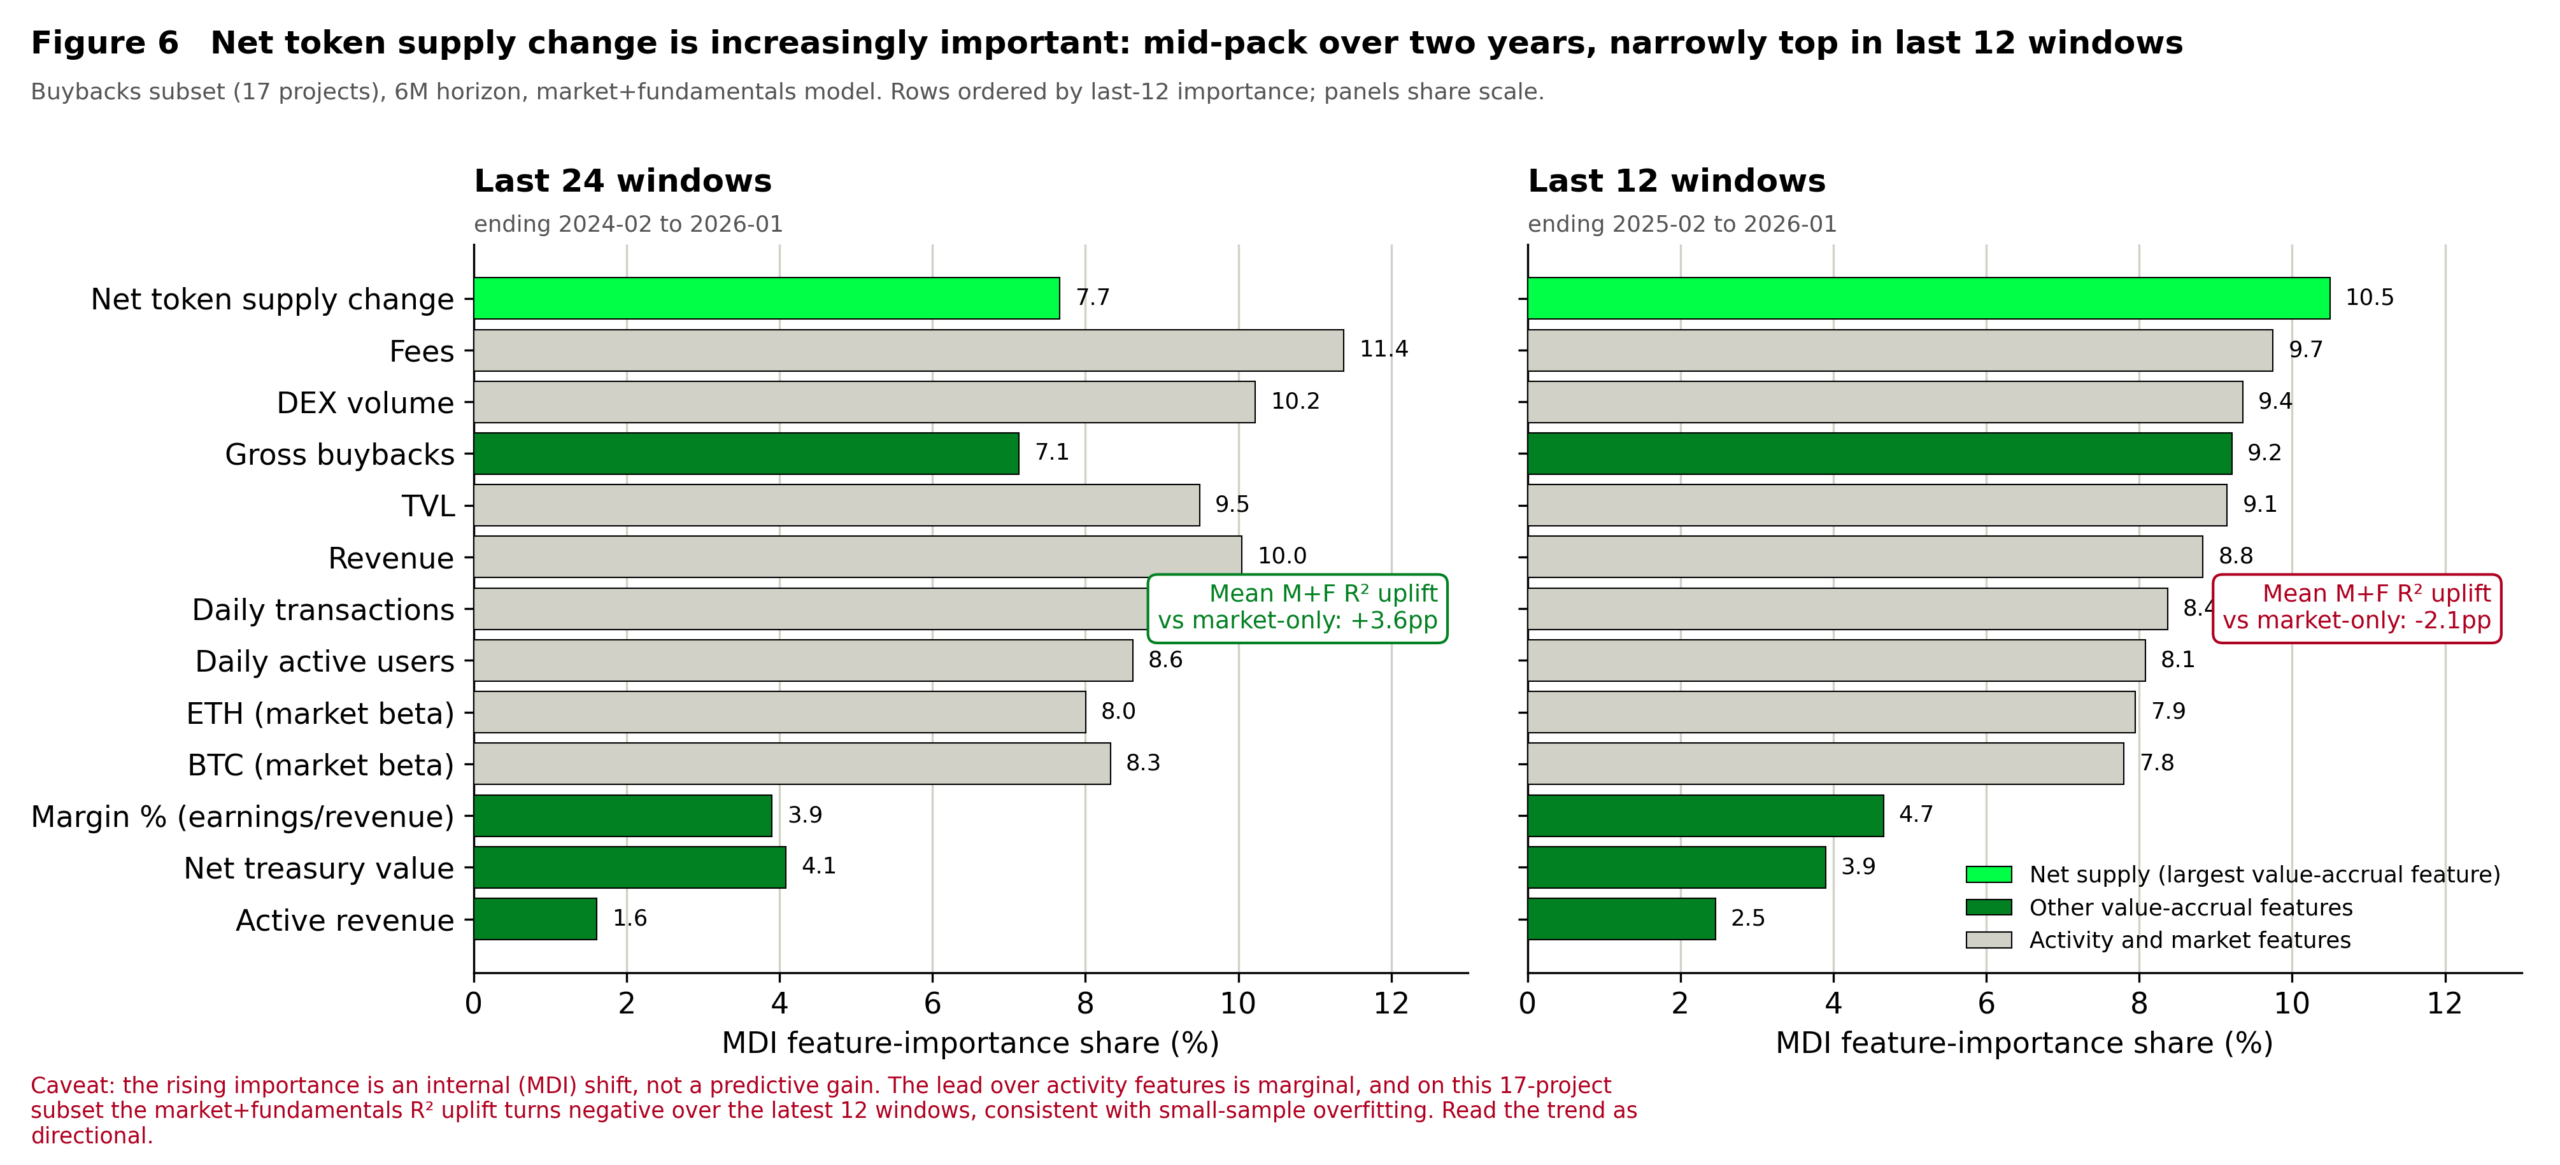
Figure 6. Mean feature-importance share on the 17-project buybacks subset (6-month horizon, market+fundamentals model), comparing the last 24 evaluation windows against the last 12). The boxed annotations report the subset's mean R² uplift over market-only in each span: +3.6 pp over the last 24 windows but −2.1 pp over the last 12, so the rising importance is an internal reallocation of model weight, not a confirmed predictive gain. Read the trend as directional.
On this subset, the buyback-augmented model’s uplift over a market-only baseline is positive over the full sample (+6.6 pp Pearson, +1.8 pp Spearman) but turns negative in the most recent windows (latest 12: roughly −2 to −3 pp on both measures), the same short, late windows in which net supply change rises to the top of the importance ranking. This is consistent with a small panel overfitting a single variable, and it is the main reason we read the supply signal as a candidate to watch rather than an established result. Also, the importance of the supply and buyback features swings widely (coefficients of variation of 0.6 and 0.8, versus roughly 0.3 for more stable signals like fees and revenue). What is more, the sample size is rather small and the latest evaluation windows are shorter by design.
These observations are an early echo of the equity-market net-issuance anomaly, in which net share issuance has been documented as one of the strongest predictors of subsequent returns, more reliable than size, book-to-market, or momentum (Pontiff and Woodgate, 2008; Fama and French, 2008), with the effect more pronounced in deeper, more developed markets (McLean, Pontiff, and Watanabe, 2009). In equities, there is also a clearly negative relationship: firms that increase shares outstanding the most tend to earn weaker subsequent returns, while firms with flat or shrinking share counts tend to perform better. Issuance captures both market timing and supply pressure. Companies are more likely to sell equity when valuations are favorable for issuers, and an increase in float must be absorbed by investors at lower expected returns. The buyback half of the picture is less mechanically clean in the equity literature: open-market repurchase announcements are associated with material post-announcement abnormal returns over multi-year windows (Ikenberry, Lakonishok, and Vermaelen, 1995), but the effect is driven heavily by undervalued repurchasers rather than by buybacks per se. The combined read is consistent with what we see in the DeFi subset: dilution tends to weigh more on token-holder returns than buybacks lift them.
Together, the revenue-over-fees movement in the main panel and the supply-versus-buyback finding in the subset lean in the same direction, though. Markets are starting to care more about value flowing to token holders, in addition to top-of-funnel activity.
6. What changed and what did not
Performance, the fundamentals-only phase, structural attention, the anchor feature, and the rotation among protocol-specific features all converge on one verdict: a durable fundamentals layer on top of market beta, increasingly rewarding monetization.
Performance (Section 1): the combined market+fundamentals specification has added a steady +3 to +5 pp of explanatory power for at least three years at the 6M horizon. The lag the November report flagged in how fundamentals get incorporated still holds: the combined model adds essentially nothing over beta at one month, a smaller but still significant increment at three months, and the full uplift only at six months. Fundamentals show up in valuations over months, not immediately.
Phase, not regime (Section 2): the fundamentals-only outperformance of 2024-H2 was a phase, not a Bull or Bear market effect. Its sign flipped within the same regime label: its deepest trough came in the 2022 bear and one of its highest peaks in the early-2025 bear. The combined model, by contrast, holds across Bull, Flat, and Bear conditions, with cohort-mean uplifts in a tight 3.7 to 4.8 pp band post-Jan-2024.
Structural attention (Section 3): the model has rotated from beta proxies (BTC growth, ETH growth) and sub-segment toward protocol-specific KPI growth, and has stayed in that regime for 29 consecutive evaluation windows since September 2023.
The anchor (Section 4): within that protocol-economics-dominated regime, TVL growth has the highest mean importance and the lowest rank rotation among all high-importance features across all 48 windows. It is the one growth feature the model leans on consistently.
Composition (Section 4): among the rotating protocol-specific features, the model has started to favor revenue over fees. They are essentially tied across the latest 12 windows, with revenue about 1.7 pp ahead across the latest 6, against a full-sample picture in which fees still lead on average. The magnitude is small, but the trajectory toward revenue is visible. A related preliminary signal on the buyback subset points in roughly the same direction: net token supply change carries roughly 2.8x the importance of gross buybacks across the full sample, and rises to the single most important feature in the most recent windows, consistent with net value reaching the token mattering more than gross activity. We read it as no more than directional, though: the subset is small, and the buyback-augmented model’s out-of-sample uplift over a market-only baseline turns negative in the most recent windows, so the importance ranking is not backed by a gain in explanatory power there.
The November report called the direction of travel. The updated panel shows a stable level sitting on a less settled composition. The market+fundamentals layer has plateaued at a statistically significant +3 to +5 pp of explanatory power, stable across regimes and anchored to TVL. The standalone fundamentals-only effect, which peaked in 2024, has compressed. What is still moving is the mix inside that layer, a slow shift from gross fees toward net revenue. A rotation within fundamentals. The level is durable; what drives it is still moving.
7. What this means
For investors
For both liquid allocators and private-market investors, the message is the same: fundamentals carry a clear explanatory premium on top of beta. At the six-month horizon, the combined model adds +3 to +5 pp of Pearson R² over a BTC/ETH baseline, holding across cohorts and regimes, with statistical significance. At one and three months, fundamentals add little, so if you are turning positions weekly, you are mostly trading beta. For underwriting, improving fundamentals do not let a token decouple from BTC/ETH for long, but they do appear to earn a durable second-layer premium against beta-matched peers, clearest at six months. Token design (accrual mechanism, supply discipline, value-capture) deserves deeper diligence than a year ago, but it is not on its own a reason to invest. Current traction, product velocity, as well as strategic positioning, thus future growth potential – all driven by the teams pushing the project forward matter significantly. And ultimately, you need to also underwrite the beta side of the book.
For protocol teams
While beta still moves valuations, protocol-specific fundamentals drive valuation differences at six-month horizons. Among the things we model, TVL growth carries the most persistent weight, indicating that investors still consider it a strong leading indicator for trust and future monetization potential in a protocol that is harder to inflate than other metrics. Besides that, revenue is increasingly being rewarded over fees, so it is increasingly important to demonstrate that a protocol can capture value to attract investor demand.
TVL anchors. Revenue separates. Beta sets the tide; fundamentals decide who rides it.
References
Fama, E.F. and French, K.R. (2008). “Dissecting Anomalies.” Journal of Finance, 63(4), 1653-1678.
Ikenberry, D., Lakonishok, J., and Vermaelen, T. (1995). “Market Underreaction to Open Market Share Repurchases.” Journal of Financial Economics, 39(2-3), 181-208.
McLean, R.D., Pontiff, J., and Watanabe, A. (2009). “Share Issuance and Cross-sectional Returns: International Evidence.” Journal of Financial Economics, 94(1), 1-17.
Novy-Marx, R. (2013). “The Other Side of Value: The Gross Profitability Premium.” Journal of Financial Economics, 108(1), 1-28.
Pontiff, J. and Woodgate, A. (2008). “Share Issuance and Cross-sectional Returns.” Journal of Finance, 63(2), 921-945.
All empirical claims are tied to Artemis-based random-forest outputs (mid-2021 to March 2026). More details on methodology are in the longer previous report.